Credit for the bulk of this code is to Abhijit Dasgupta and the commenters on the original post here from earlier this year. I have made a few changes to the functionality of this which I think warrant sharing.
A brief intro, this function will use the output from a survival analysis fitted in R with ‘survfit’ from the ‘survival’ library, to plot a survival curve with the option to include a table with the numbers of those ‘at risk’ below the plot.
Changes to Abhijits version included in here:
- Ability to plot subgroups in multivariate analysis
- Ability to set x and y limits (as an argument in the function)
- Strata are now ordered (so strata order in legend will match that in ‘at risk’ table)
- Minor changes to code layout/structure
The major change here, and the motive for toying with the code, was to be able to plot for subgroups. I don’t know how common it is to only have one variable in your survival analysis, but the way the code was set up was to plot one line for each unique level grouping in the analysis. So if you have gender, a two level treatment (A and B) and three age groups (1,2,3), you would get a line for males on treatment A aged 1, a line for males on treatment A aged 2, a line for males on treatment A aged 3, a line for males on treatment B aged 1 etc etc.
This is executed, as you can see, with a regular expression (assistance from bioinformatician Richard Francis appreciated).
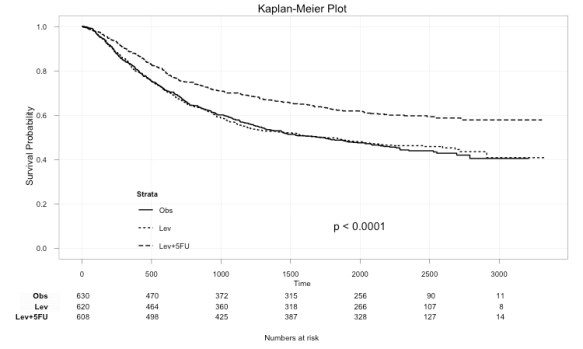
So a basic plot, using Abhijit’s example, would now look like this.
library(survival)
data(colon)
fit <- survfit(Surv(time,status)~rx, data=colon)
ggkm(fit, timeby=500, ystratalabs=c("Obs","Lev","Lev+5FU"))
Note: the strata names are now in (the same) order in legend and the table below.
Now say you had another variable you were adjusting for. I’ve assume that the ‘adhere’ variable in the data is full adherence to the treatment regime, and that 0 is Yes and 1 is No (logic to me had 0 as No and 1 as Yes but the 1’s seem to have a worse plot… will research the dataset and update when I get a chance).
colon$adhere <- factor(colon$adhere,labels =c("Yes","No"))
fit <- survfit(Surv(time,status)~rx + adhere, data=colon)
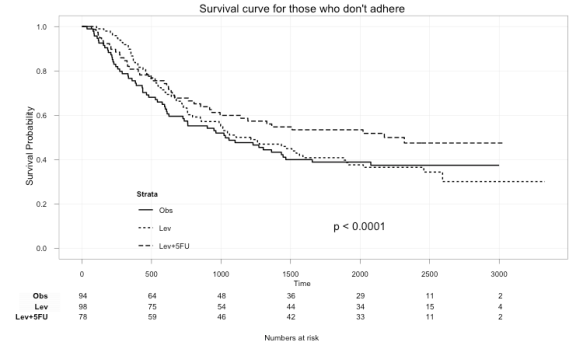
Here we can plot just those that didn’t adhere to the treatment:
ggkm(fit, timeby=500, ystratalabs=c("Obs","Lev","Lev+5FU"), subs="No", main="Survival curve for those that don't adhere")
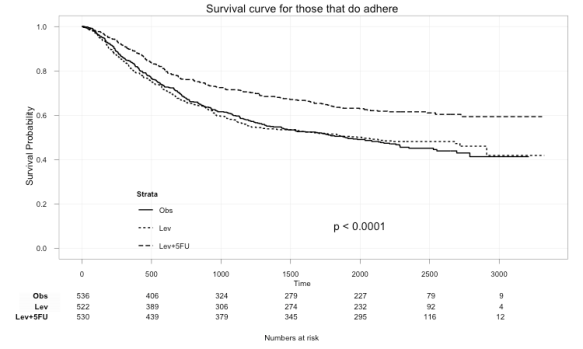
ggkm(fit, timeby=500, ystratalabs=c("Obs","Lev","Lev+5FU"), subs="Yes", main="Survival curve for those that do adhere")
With this you can now easily see the difference in survival for those that did not and those that did adhere to treatment.
This also works for multiple variables. Like if you had sex in the model too, you could use:
ggkm(fit, timeby=500, ystratalabs=c("Obs","Lev","Lev+5FU"), subs=c("Yes","Male"), main="Survival curve for those Males that do adhere")
And, here’s the code. Comments welcomed.
CODE WAS BROKEN by an update in versions (either R or ggplot). Working code available here.


Thanks for the code Matt.
Trying this from your website
ggkm(fit, timeby=500, ystratalabs=c(“Obs”,”Lev”,”Lev+5FU”), subs=”No”, main=”Survival curve for those that dont adhere”)
I get this error (R2.14 windows)
Erreur : Labels and breaks must be same length
Also I was wondering if the function works for a single curve as I am getting this error on my data
fit <-survfit(Surv(failtime,newfail)~1,data=faildf)
ggkm(fit)
)
Erreur dans data.frame(time = sfit$time[subs2], n.risk = sfit$n.risk[subs2], :
arguments imply differing number of rows: 1, 0
De plus : Message d'avis :
In max(nchar(ystratalabs)) : aucun argument pour max ; -Inf est renvoyé
Looking at the code it looks like you need to have a strata for the function to work.
Thanks for any help. Best wishes, JL
Thanks for the comment Jean. With the first issue, that was my mistake, I left two lines out in my hurry to get this up that recode the adhere variable and then re run the model. Try this now and it should work.
You’re right, this doesn’t allow for fitting a single curve. Hadn’t considered that as an option. Will hopefully get some time to review that over the next few weeks and update to factor it in.
What a fantastic idea to improve the code! Great job! Everything works fine here (R2.14, RStudio 0.95.165)
I wish there was some switch in the function to control the size of the text in the graph/legend/axis/table. Is this possible?
The survplot function in the rms package will also show the at-risk table.
Stratos, there isn’t currently. It could be easily added but I won’t get a chance to look at this for a while. In the meantime you could maybe just add it in directly to the function prior to running it.
Harrelfe, sounds good, I’m not sure the original reason for manually calculating this (given I didn’t write the original code), but I assume it was necessary to have it match up with the axis breaks properly (with the timeby element of the function). But don’t quote me on that.
Everything works fine and what a great plot!
When using “subs=” option, is it possible to update the p value accordingly? The current code ignores the “subs=” option when calculating the p value.
Hi Wei, That’s a good point, I’ll add this to the list to check into. Personally I haven’t been using the p-value option, it was just legacy from the code when Abhijit wrote it. A late reply from me I know, you could try leaving the p-value option off and manually position a p-value in their with ‘mtext’?
Actually the p-value can be updated with “annotate”. Note that my running version has a returns option, which allows export of the ggplot object. You can then update the p-value by hand by
p <- ggkm(….., returns=T)
p$gg + annotate('text', x=…, y=…, label="P = 0.04")
In any case, I'm happy the code has formed the basis for other coding endeavors for this. I would also like to acknowledge Frank Harrell's comment that survplot does add the at-risk table.
Cheers,
Abhijit
Hi, I’ve written an R function that produces a KM plot with at risk table, and recently I made a lot of improvements. I thought you might be interested.
http://biostat.mc.vanderbilt.edu/wiki/Main/TatsukiRcode#kmplot
By the way, in this example (colon), “adhere” indicates tumor adherence to nearby organs (which is a bad thing), not adherence to the treatment…
Wonderful!! Thanks a lot!!
I tried your script with the following commands
fit <- survfit(Surv(LC_Monate, Lok_Rez)~minBED_GTV_Groups, data=dat_LC)
ggkm(fit, timeby=12)
and receive the following error message:
error in `[.data.frame`(data, "group") : undefined columns selected
Before, I had trouble with rbind.fill object not found which I solved by including plyr.
Unfortunately, so far I was not able to get plot.
Any help very appreciated.
Hi, I got this error
“Error in `[.data.frame`(data, “group”) : undefined columns selected”
and can’t figure it out.
Thanks!
Tim
Pingback: Kaplan-Meier Survival plot – with at risk table, by sub groups « Matt's Stats n stuff
Hi guys,
You’re right, something broke, probably due to an update. Was simply an argument within ggplot(…) that needed removing. Please see most recent post, this is now fixed.
Can you let me know where the code is located?
Pingback: The R-Podcast Episode 8: Visualization with ggplot2 » The R-Podcast
Pingback: The R-Podcast Screencast 2: Visualization with ggplot2 » The R-Podcast
Thanks a lot for your nice code.. I have a problem with ystratalabs.. I need to insert an expression.. referring to your example on colon dataset:
ggkm(fit, timeby=500, ystratalabs=c(expression(paste(alfa,”B2″,sep=””)<0),"Lev","Lev+5FU"))
but: 1) the expression is not evaluated and 2) at risk table appears completely misplaced.
Thanks for any help. Cheers,
Angela
Thanks for this ! I was wondering if you have updated this with the new syntax, to avoid all the messages such as
‘theme_blank’ is deprecated. Use ‘element_blank’ instead.
‘opts’ is deprecated. Use ‘theme’ instead.
Setting the plot title with opts(title=”…”) is deprecated.
?
Thanks for the code, great looking results! I am running into a coupe of minor issues though, hoping you have some insight to share – I’m trying to interrupt the y axis to start at, say, 0.4 instead of 0.0 for presentation purposes, but I keep getting this error.
> ggkm(fit,ystratalabs=c(“Q1″,”Q2″,”Q3″,”Q4″,”Q5”), xlims=c(0,180), ylims=c(0,1), timeby=30,)
this works fine, but this:
> ggkm(fit,ystratalabs=c(“Q1″,”Q2″,”Q3″,”Q4″,”Q5”), xlims=c(0,180), ylims=c(0.2,1), timeby=30,)
gives me this error and warning:
Error in unit(x, default.units) : ‘x’ and ‘units’ must have length > 0
In addition: Warning message:
Removed 1 rows containing missing values (geom_text).
I’m also trying to get the numbers at risk to line up perfectly with the x axis, as they’re a little out of whack there as well. Any tips would be very much appreciated, still slowly learning my way around R’s graphic capabilities…
Hi
I was trying to use the code on RStudio 0.97.551 running R 3.01 and I got the following error message
Loading required package: ggplot2
Loading required package: gridExtra
Loading required package: grid
‘opts’ is deprecated. Use ‘theme’ instead. (Deprecated; last used in version 0.9.1)
theme_text is deprecated. Use ‘element_text’ instead. (Deprecated; last used in version 0.9.1)
‘opts’ is deprecated. Use ‘theme’ instead. (Deprecated; last used in version 0.9.1)
‘theme_blank’ is deprecated. Use ‘element_blank’ instead. (Deprecated; last used in version 0.9.1)
‘opts’ is deprecated. Use ‘theme’ instead. (Deprecated; last used in version 0.9.1)
‘opts’ is deprecated. Use ‘theme’ instead. (Deprecated; last used in version 0.9.1)
theme_rect is deprecated. Use ‘element_rect’ instead. (Deprecated; last used in version 0.9.1)
‘opts’ is deprecated. Use ‘theme’ instead. (Deprecated; last used in version 0.9.1)
‘opts’ is deprecated. Use ‘theme’ instead. (Deprecated; last used in version 0.9.1)
Setting the plot title with opts(title=”…”) is deprecated.
Use labs(title=”…”) or ggtitle(“…”) instead. (Deprecated; last used in version 0.9.1)
‘opts’ is deprecated. Use ‘theme’ instead. (Deprecated; last used in version 0.9.1)
‘theme_blank’ is deprecated. Use ‘element_blank’ instead. (Deprecated; last used in version 0.9.1)
‘theme_blank’ is deprecated. Use ‘element_blank’ instead. (Deprecated; last used in version 0.9.1)
‘theme_blank’ is deprecated. Use ‘element_blank’ instead. (Deprecated; last used in version 0.9.1)
‘theme_blank’ is deprecated. Use ‘element_blank’ instead. (Deprecated; last used in version 0.9.1)
‘theme_blank’ is deprecated. Use ‘element_blank’ instead. (Deprecated; last used in version 0.9.1)
‘theme_blank’ is deprecated. Use ‘element_blank’ instead. (Deprecated; last used in version 0.9.1)
‘theme_blank’ is deprecated. Use ‘element_blank’ instead. (Deprecated; last used in version 0.9.1)
I believe it needs updating?
Thanks
G’day,
Thanks for the great R code, I found it very useful. However, when I used the code from “http://pastebin.com/FjkWnCWm”, it did not display tick-marks indicating event status, which are part of a standard Kaplan-Meier plot. I have hacked a few additional lines to add these tick-marks. Here are the lines I added which seem to work, although I’m not sure if this is the “correct” way to do this in ggplot2:
# Just below this line:
geom_step(aes(linetype = strata), size = 0.7) +
# I added these lines of code:
geom_point(aes(alpha = factor(n.event)), size = 3, shape=124, show_guide = FALSE) +
scale_alpha_manual(values = c(1, 0)) +
Cheers,
Tom